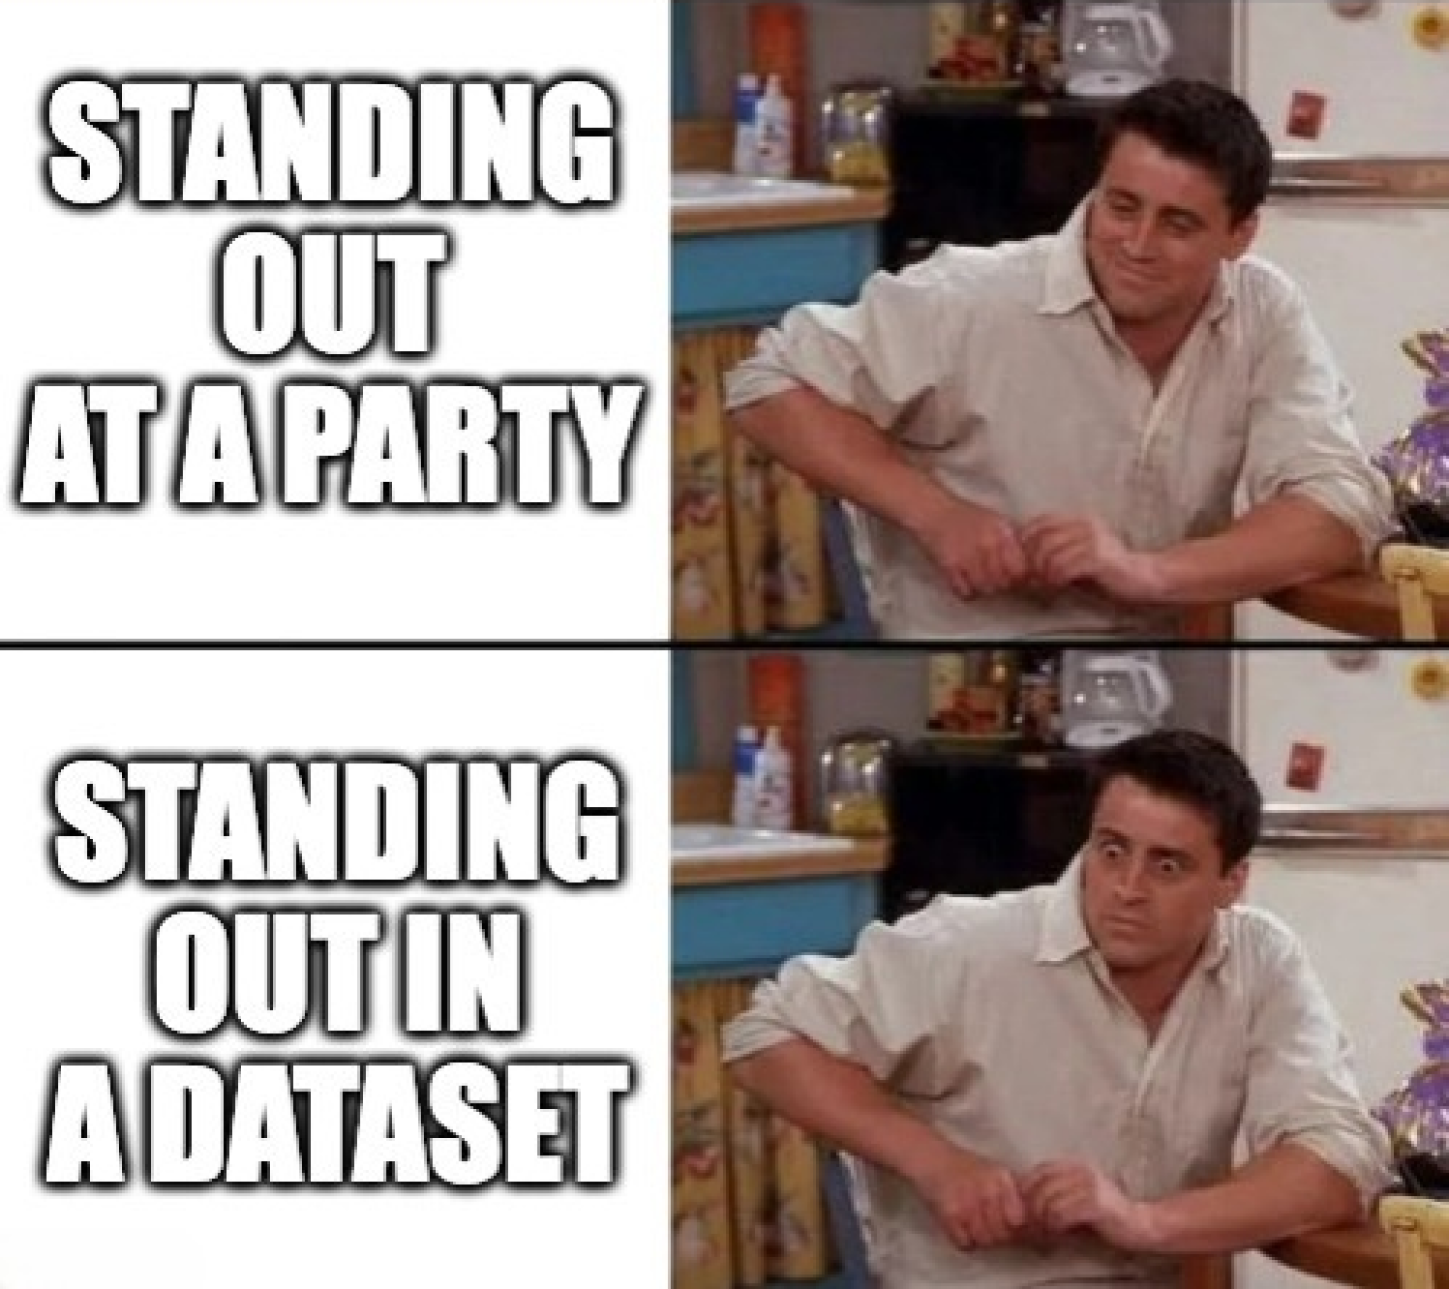
Standing out at a party can be fun, but in the world of data science, it can be a party-crasher. Data anomalies are samples in a dataset that deviate from the expected “normal behaviour”, and just like in real life, being different does not imply being bad. Quite the opposite, anomalous samples can be the most useful elements to curate. Intuitively, these represent rare and underrepresented scenarios or involve wrong data that shouldn’t have been included in the first place. Addressing them is essential for maintaining data quality and ensuring robust and safe AI decision-making.
In this article, we will showcase examples of anomalies on the public dataset RailSem19 and highlight how analysing them allows us to uncover and fix data quality issues.
RailSem19: A Dataset for Semantic Rail Scene Understanding
The RailSem19 dataset consists of 8500 scenes taken from the ego-perspective of a rail vehicle. The annotations consist of pixel-wise labels of rail tracks, rail lines, cars, humans, sidewalks, and more, allowing for precise segmentation of the scene and utilisation for rail and road-like applications such as autonomous systems and preventive maintenance.
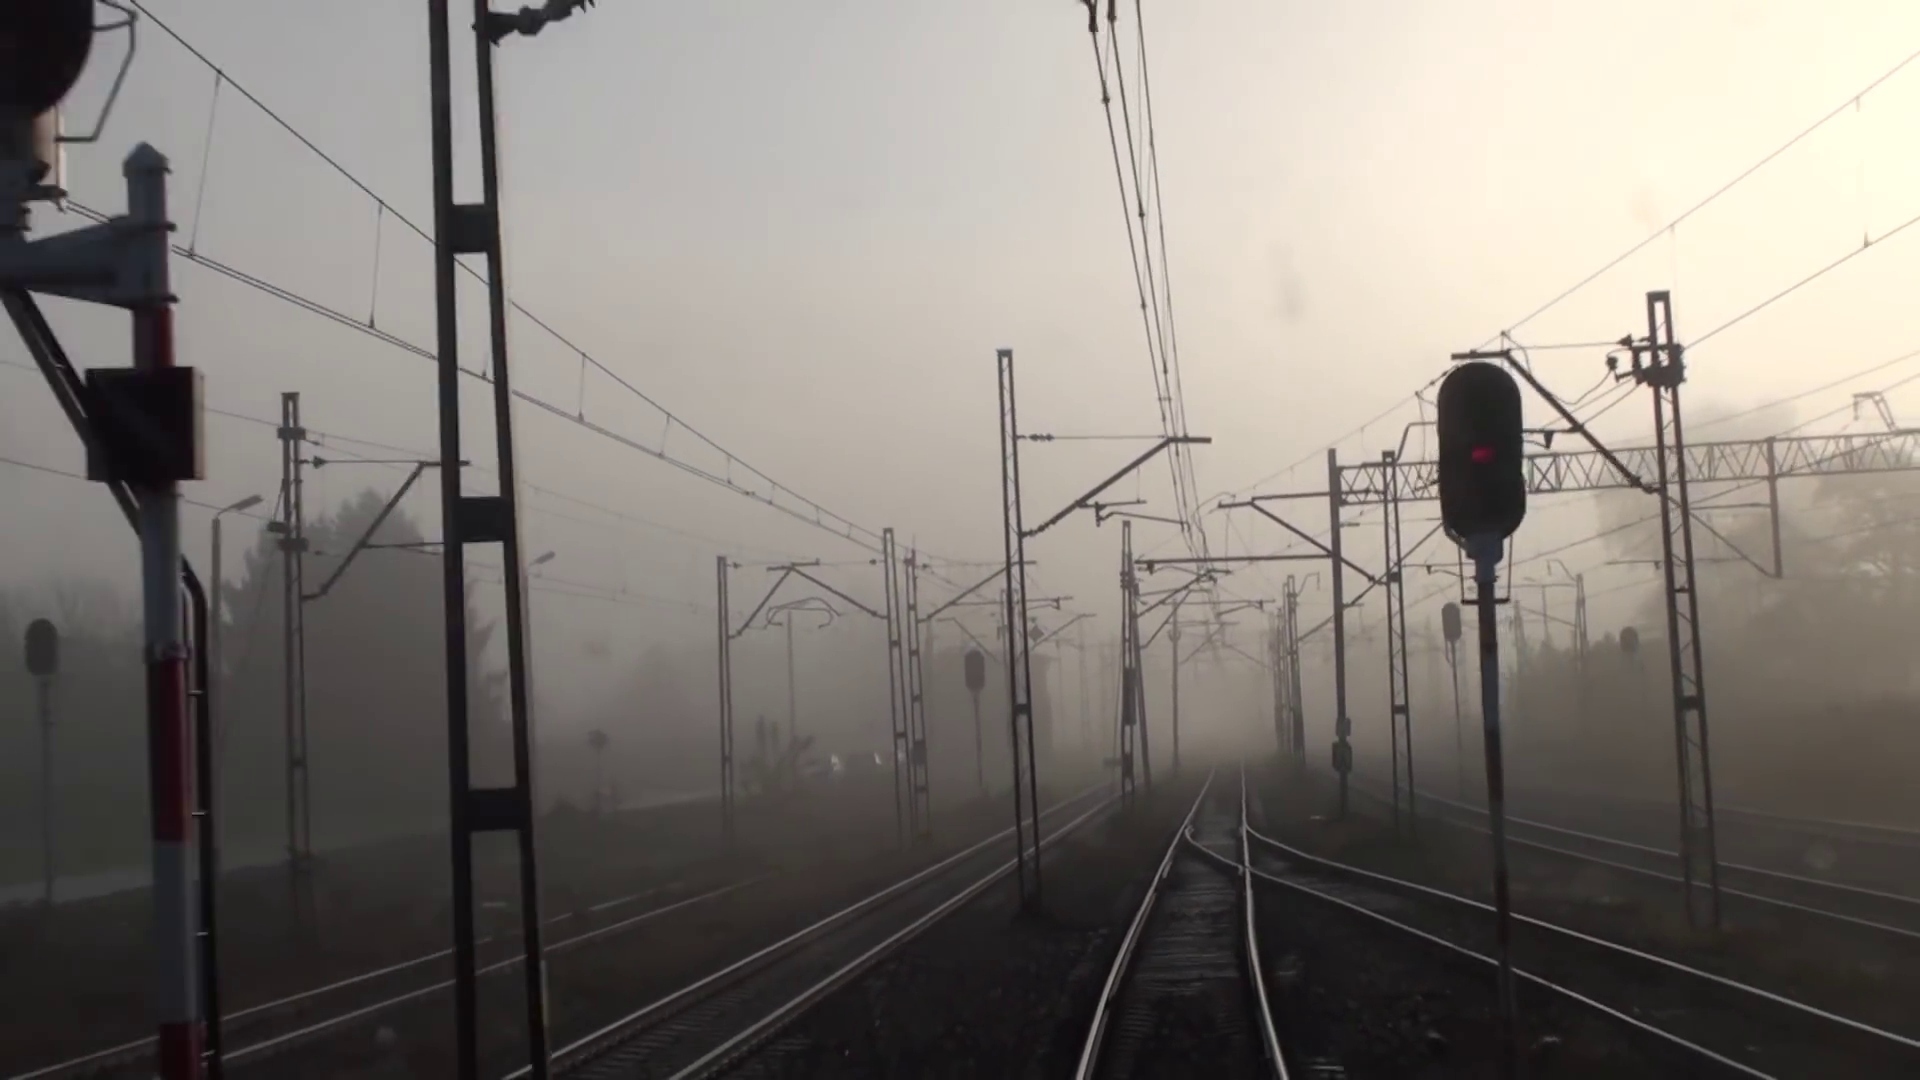
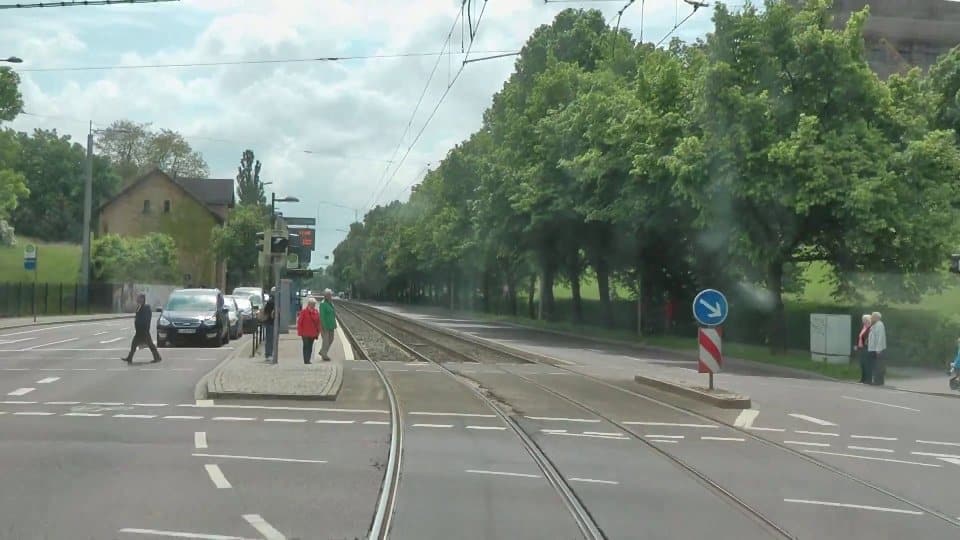
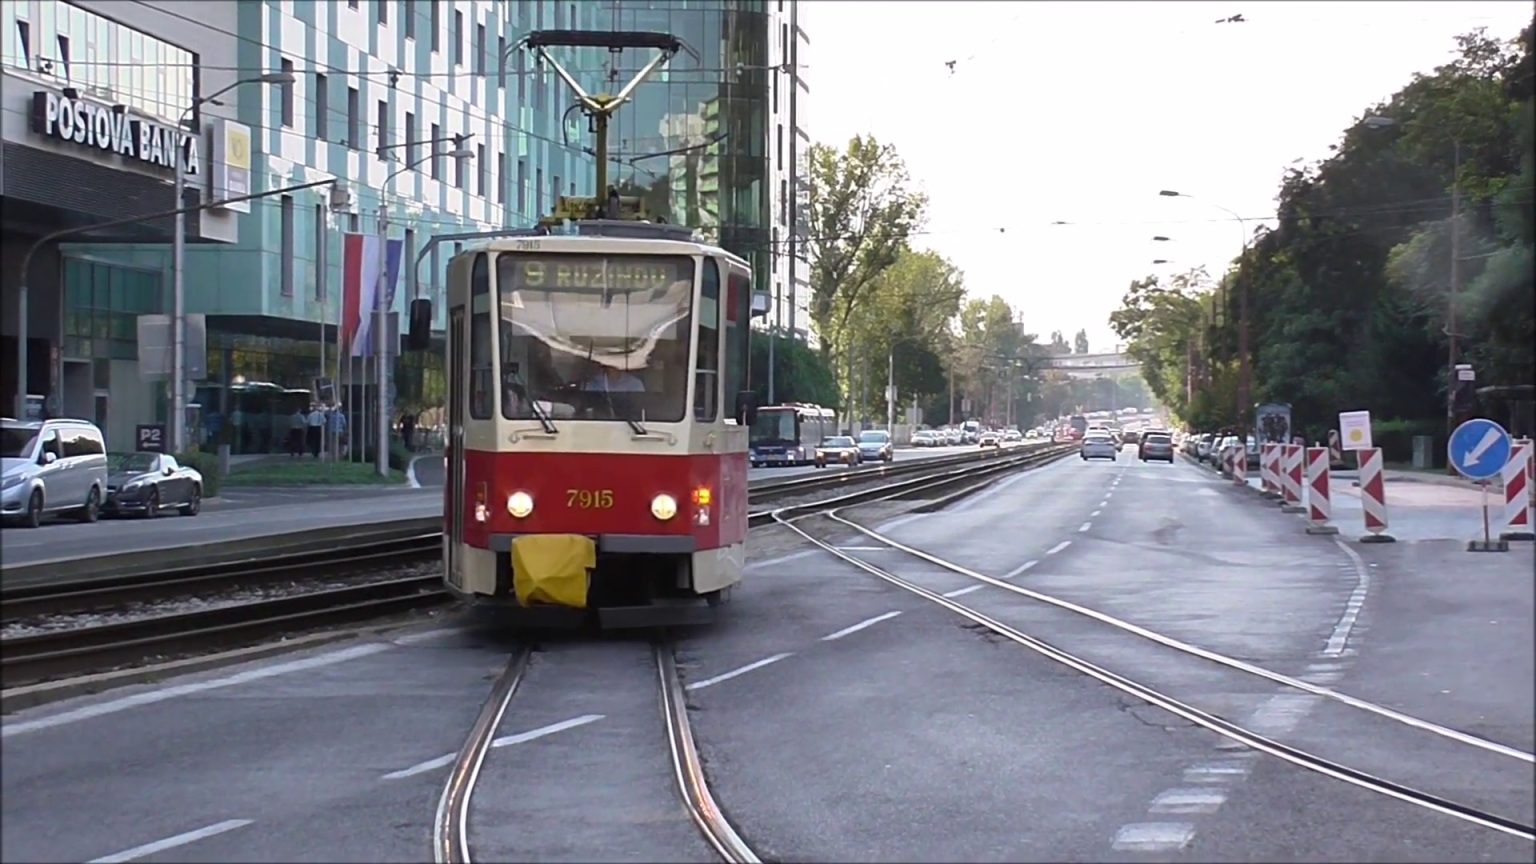


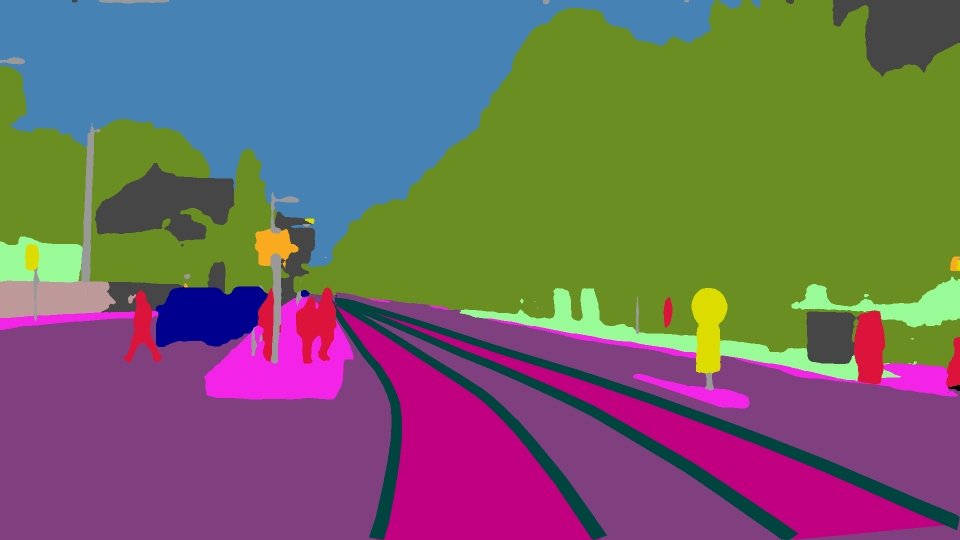

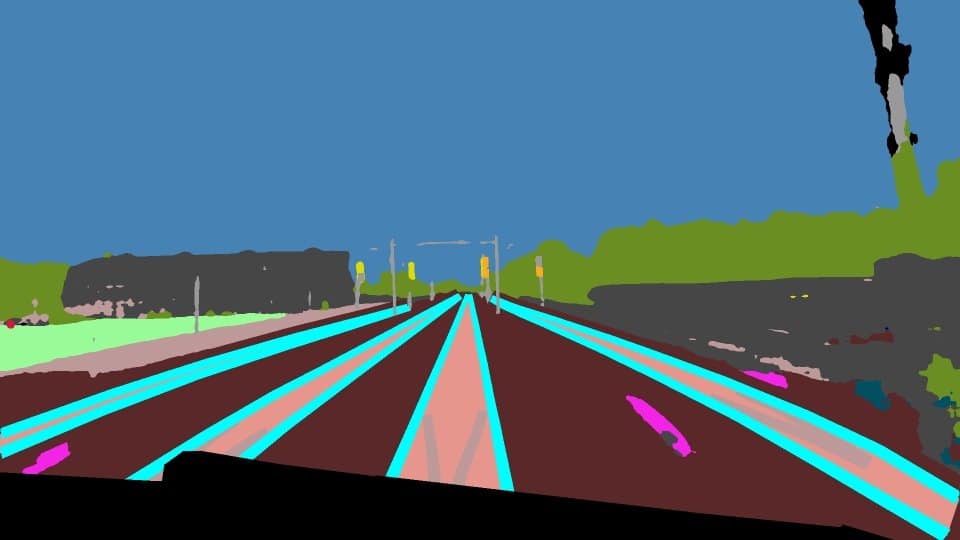
In this article, we use the three-class RailSem19 variation, which consists of rail tracks, rail lines, and all other classes mapped to the background.
Image-Level Analysis: Uncovering anomalous images
Through image-level analysis, we can uncover deviations from the expected norms or patterns, such as unexpected environmental conditions, irregularities in the scene composition, or the presence of unusual events. Finding image-level anomalies is crucial for gaining insights into the dataset subsets’ representativeness and for ensuring optimal model performance in safety-critical scenarios.
Before uncovering anomalous images, we first examine the dataset norm to ensure that we understand what common samples look like.
Understanding the norm: Common samples in the RailSem19 dataset
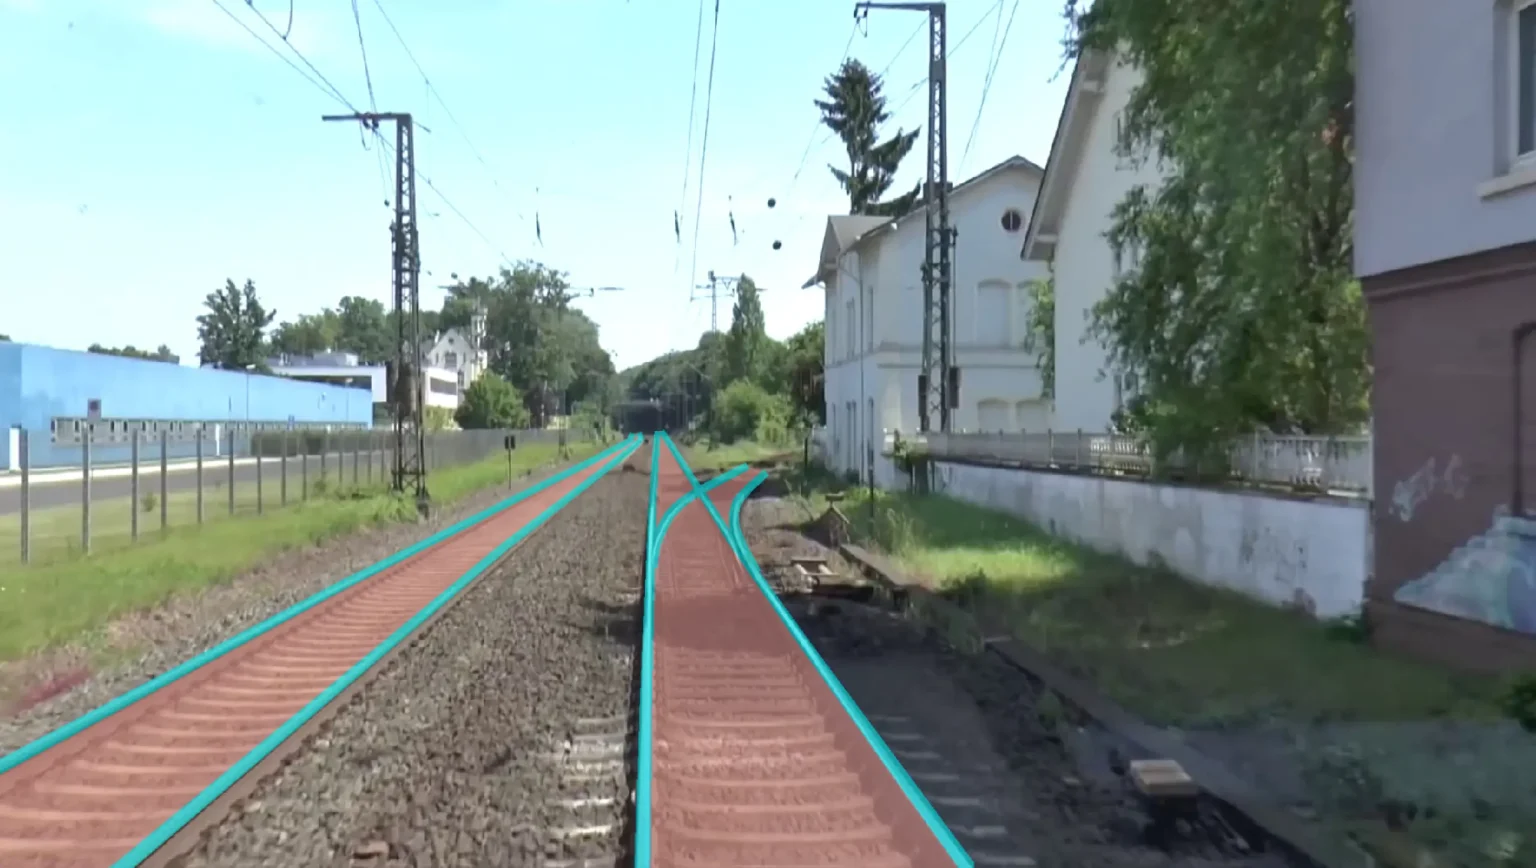
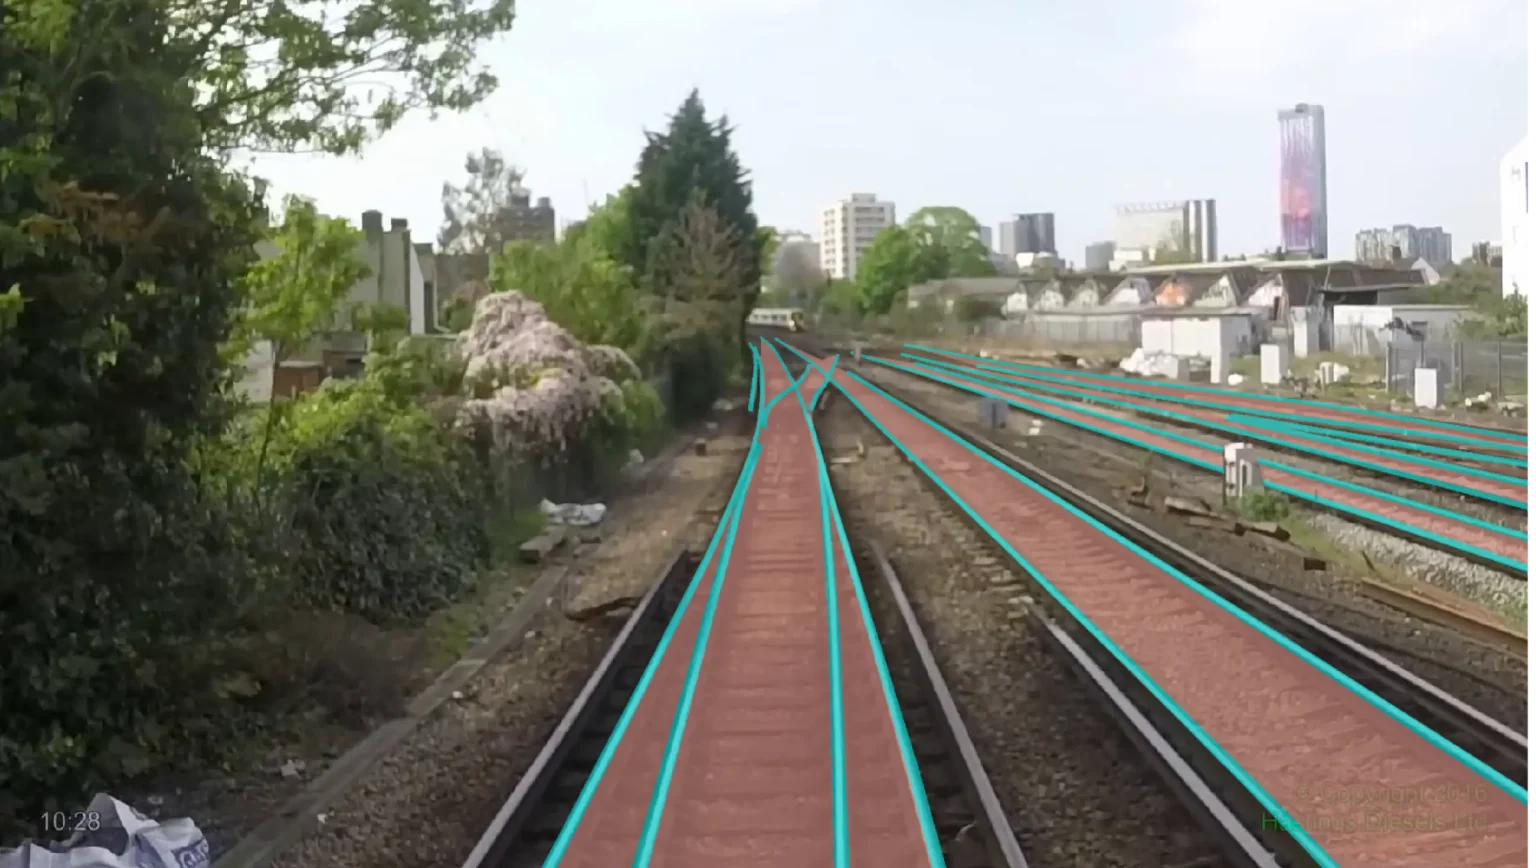
Common samples in the dataset represent scenes with a clear view of the rail tracks, railway infrastructure, and surrounding landscapes in both urban and rural areas with no unusual objects or events in sight.
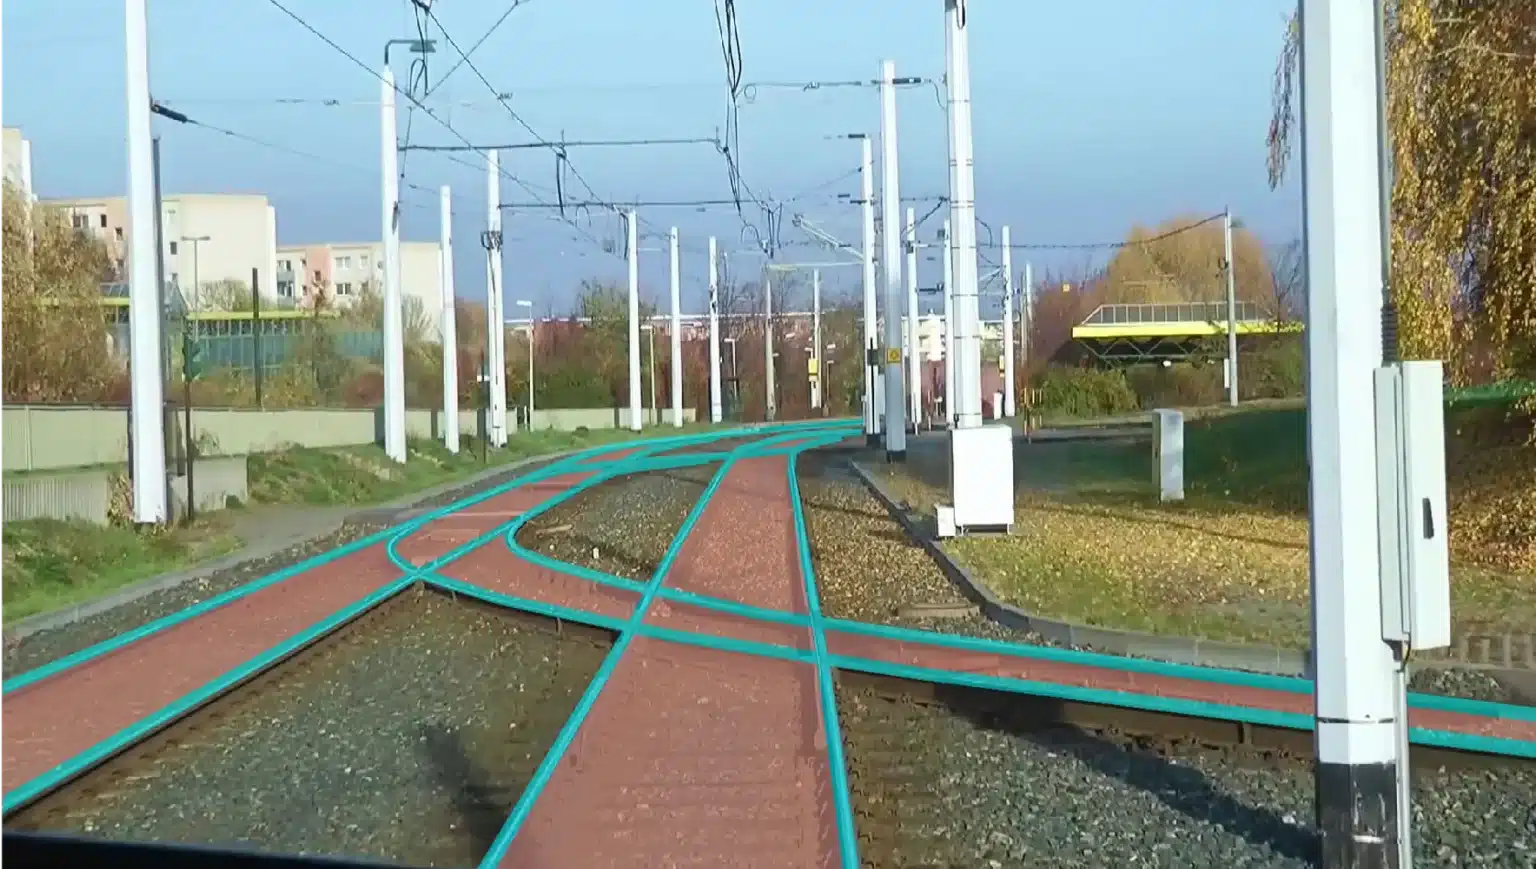
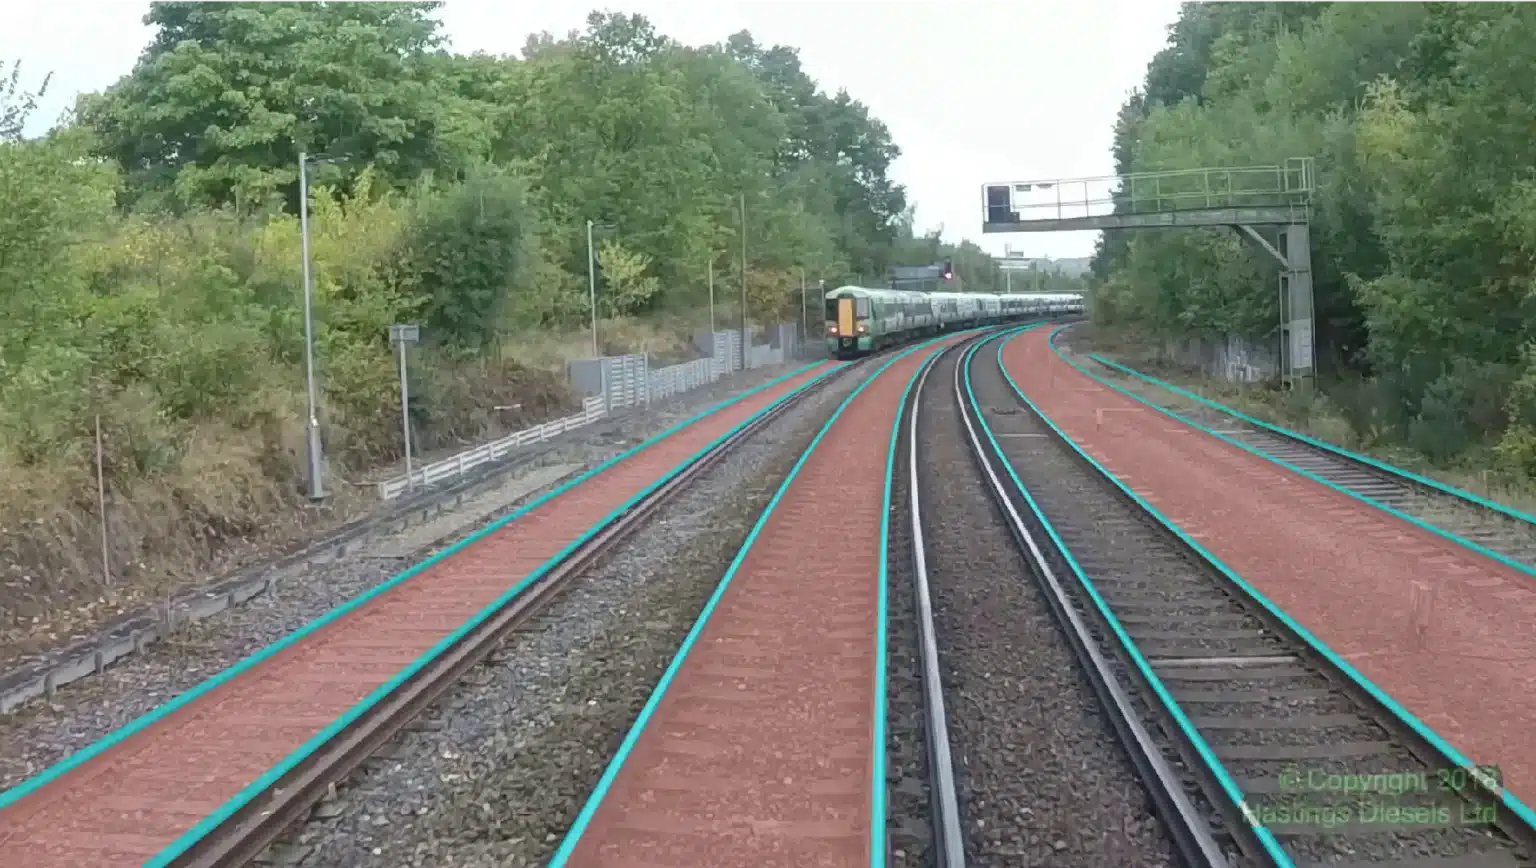
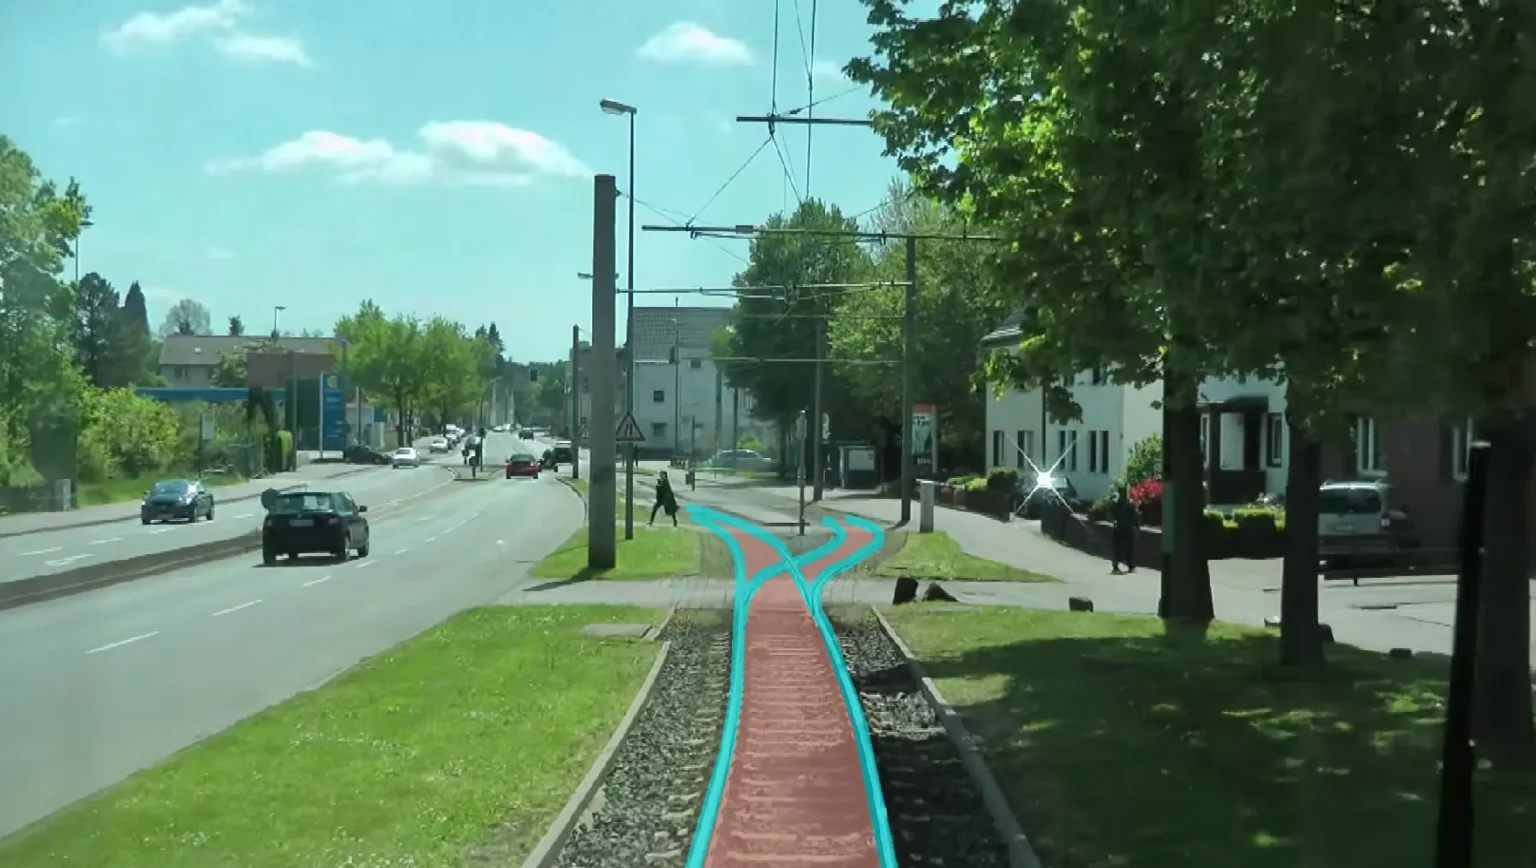
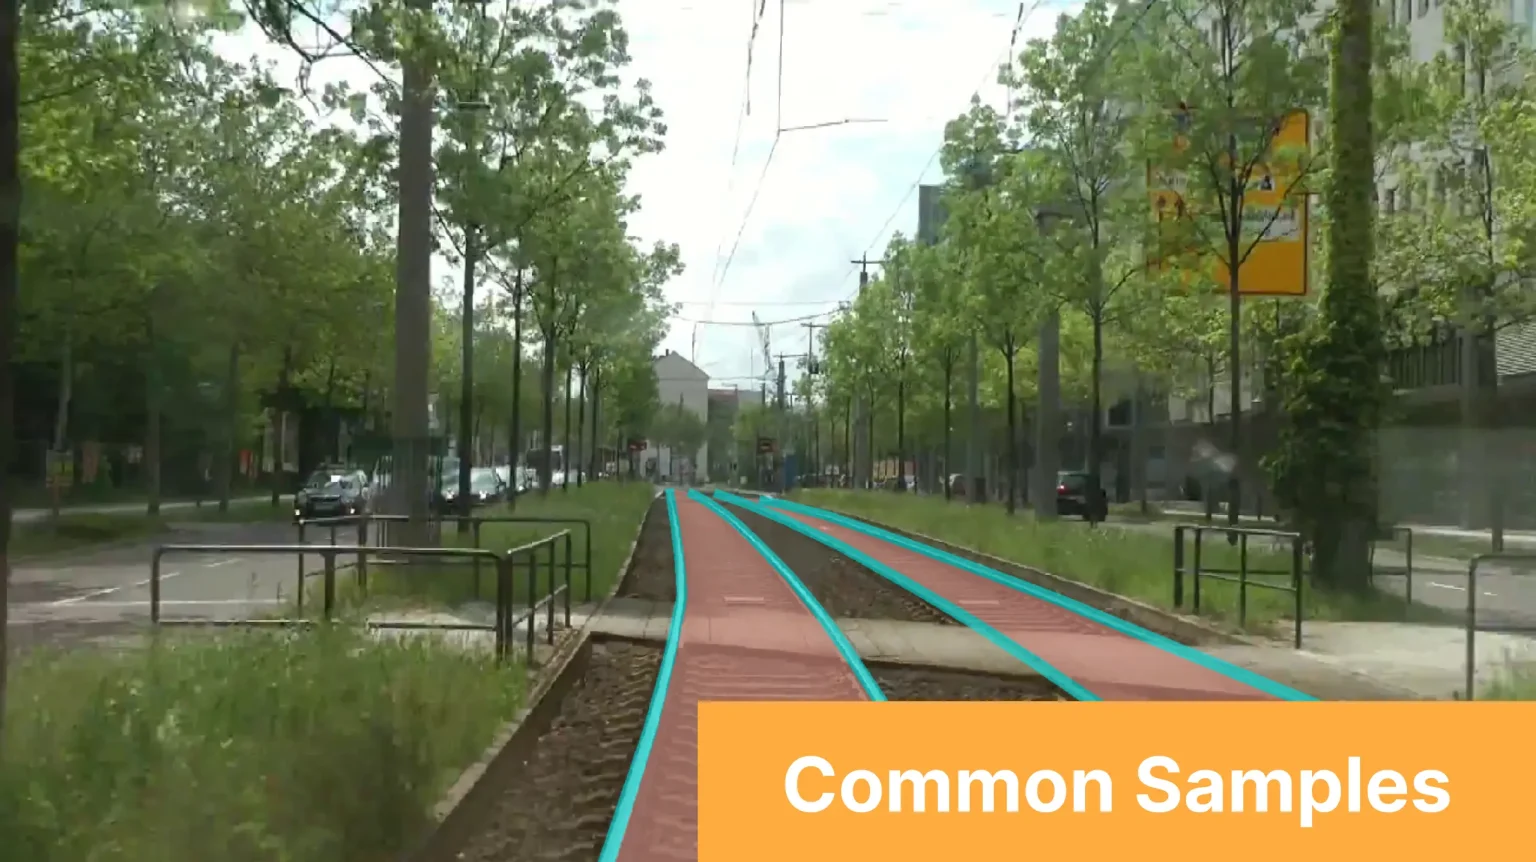
RailSem19: A Dataset for Semantic Rail Scene Understanding
Understanding common samples is essential, but ensuring a high-quality dataset goes beyond understanding the norm. One of the core challenges when building autonomous systems is ensuring that the system generalises to both common and rare scenarios (i.e., the long tail samples) and does so accurately [1]. Therefore, the dataset must be curated to be representative of all the scenarios where the model is expected to work when deployed — in other words, to ensure that rare samples in the real world are sufficiently represented in the dataset.
Identifying anomalous samples
Anomalous samples can be conceptually grouped by a common theme or characteristic. Specifically for RailSem19, we can group them into two categories: environment-specific and rail-specific anomalies.
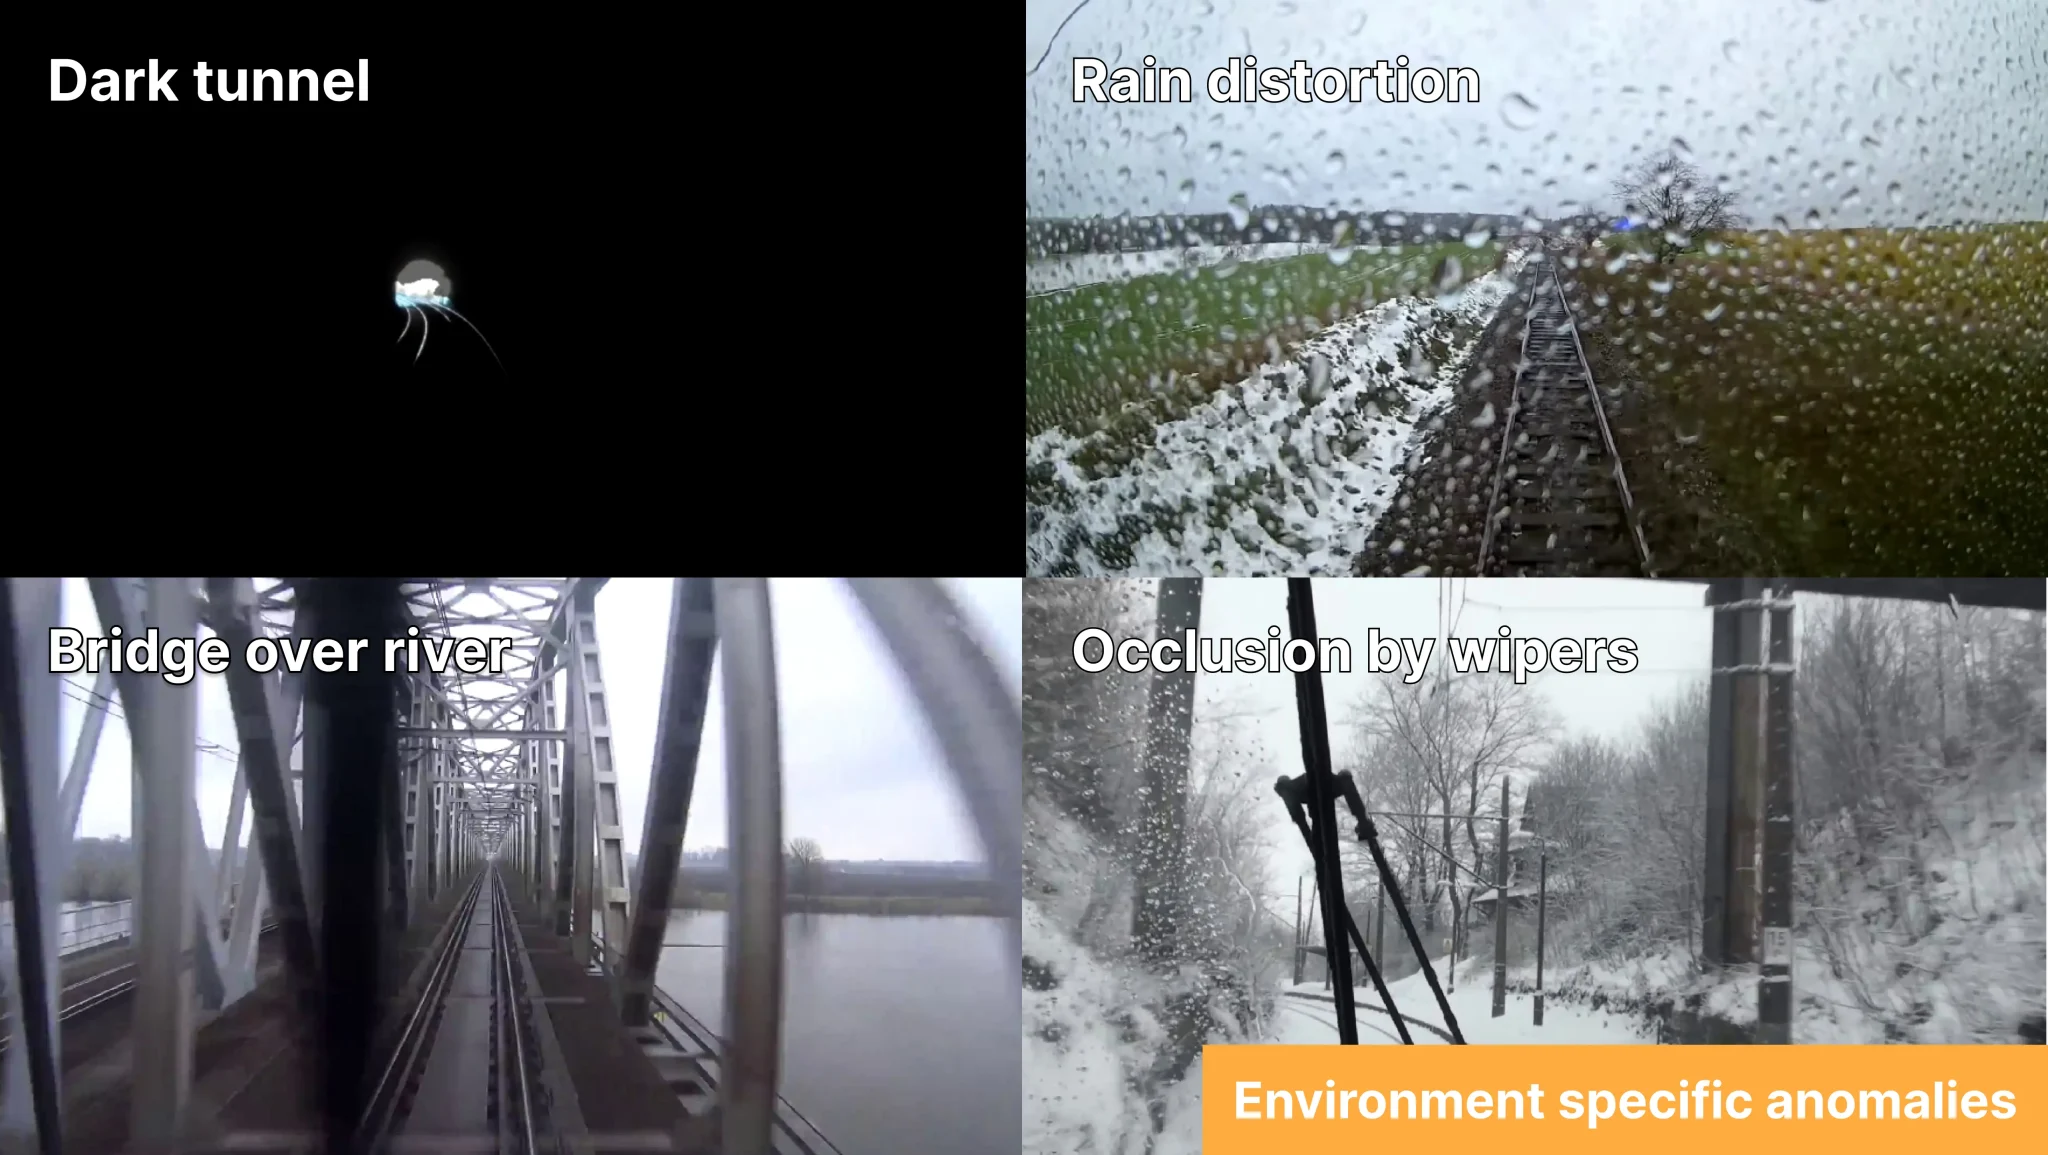
Environment-specific anomalies represent scenes with unusual conditions in the data. Examples include uncommon lighting conditions (e.g., dark tunnels vs. illuminated tunnels), weather (e.g., rain distortion vs. sunny and dry weather), location (e.g., bridges over rivers vs. flat land), and occlusions (e.g., by wipers and tree branches). We can use environmental anomalies to gain insights and define the operational domain of the environment where the model will be deployed, thereby enhancing reliability.
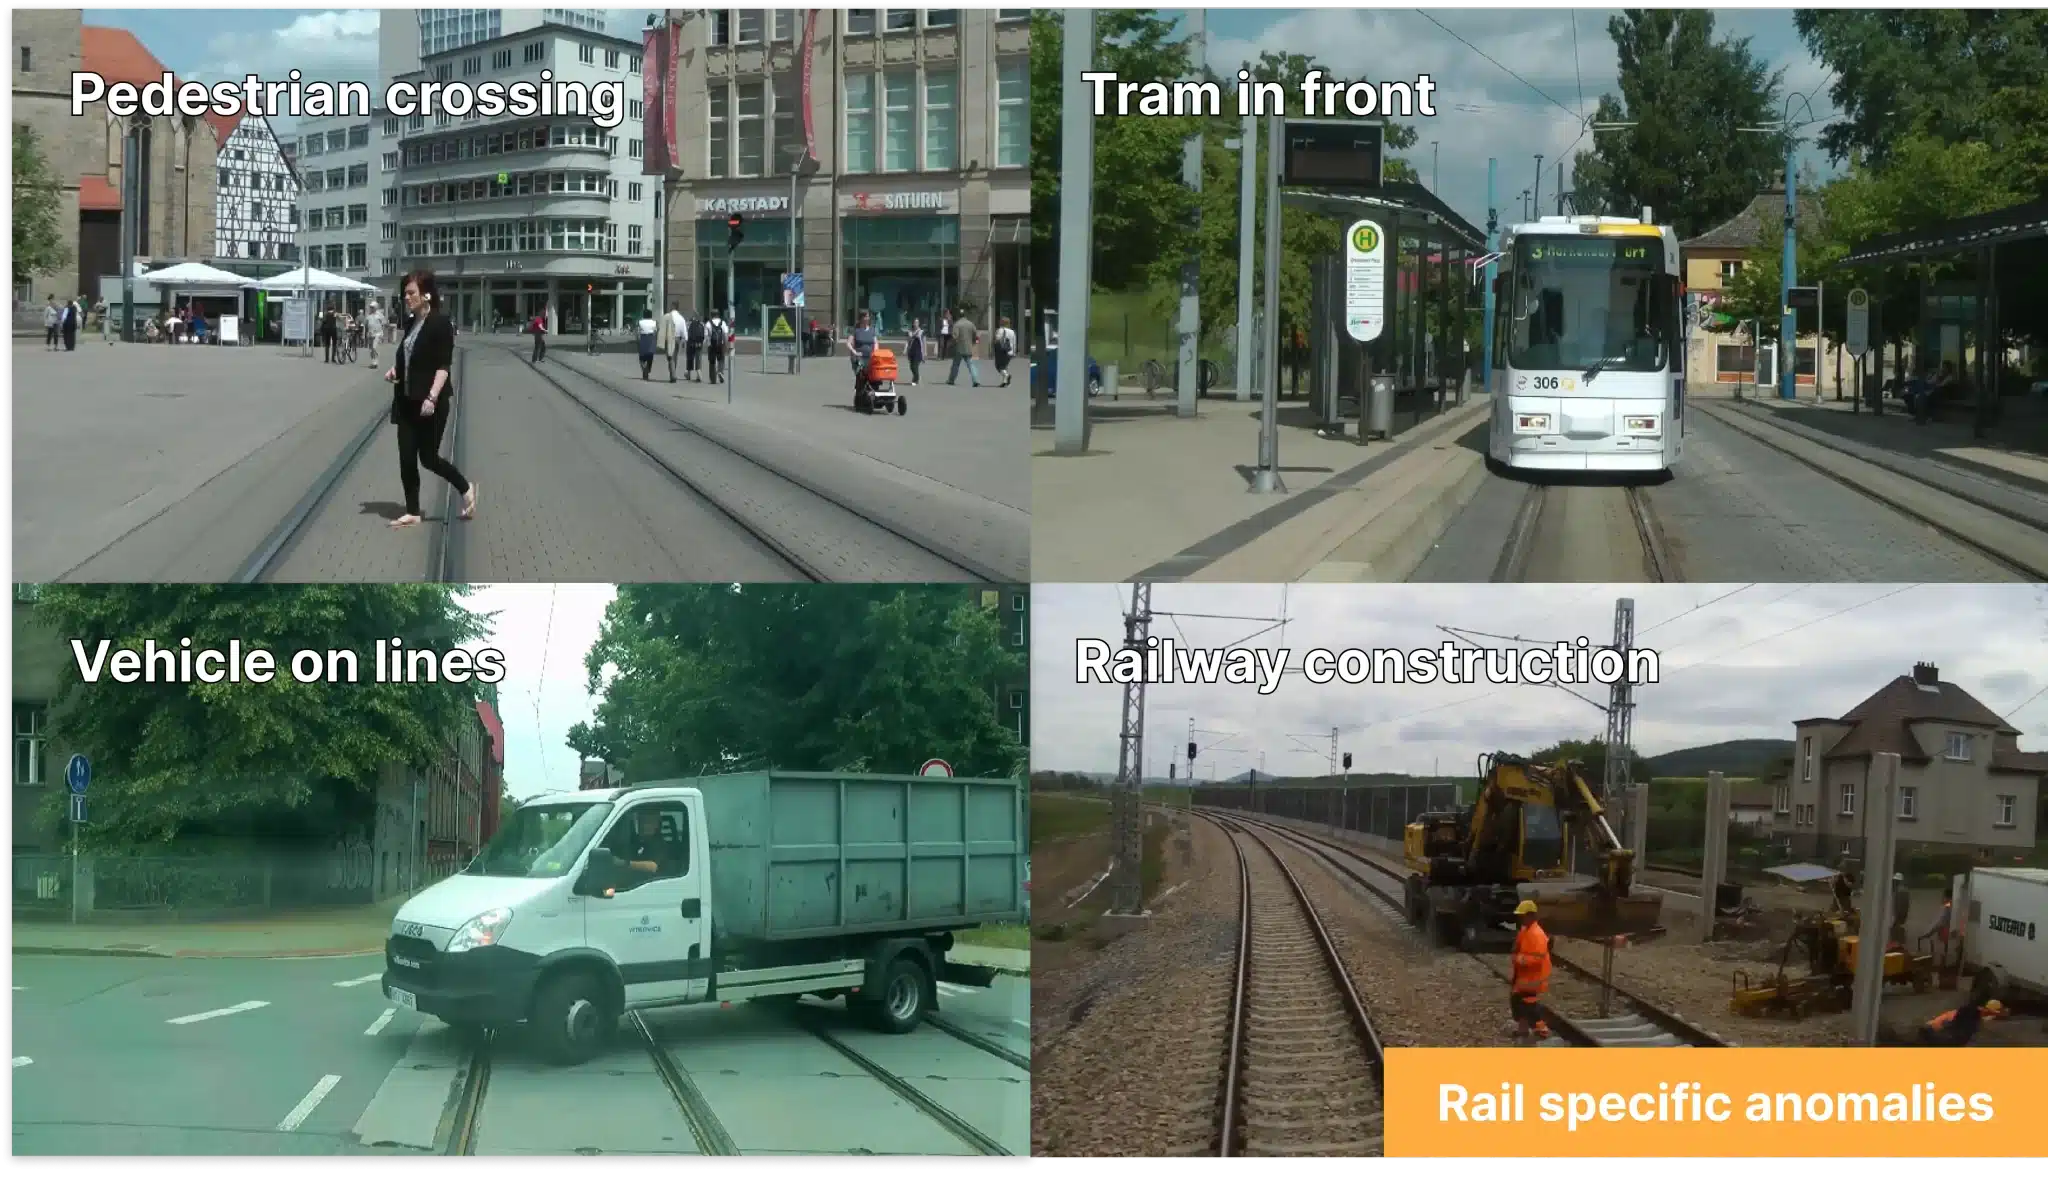
Rail-specific anomalies include scenes where foreign entities interfere with the railway tracks, such as pedestrians and vehicles crossing the tracks, other trains or trams in front, or railway construction in the background. Unlike the common samples, these correspond to important scenarios where the correct model behaviour is critical to avoid accidents. Therefore, we can use rail-specific anomalies to ensure the model performs within the operational limits in each safety-critical scenario.
Having seen individual cases of anomalous samples, the next natural step is to curate them by grouping them into scenarios based on their characteristics. Before discussing how we can automate this step, we will first explore and analyse the dataset for anomalies at a more granular level.
Beyond image-level analysis: Object-level anomalies
When working with object detection or segmentation models, the ground-truth labels and predictions correspond to bounding boxes, instance or segmentation masks. These are objects at a much smaller granularity than the whole image, yet the same challenges apply — some objects are common while others are bizarre. Such object-level anomalies often remain unnoticed when analysing the dataset at image level, simply because the objects are too small and because they are not the primary focus of the analysis. Object-level anomalies are crucial for good model performance as they correspond to the 1-to-1 mapping with what the model is trained to predict.
Common objects in the RailSem19 Dataset
Before delving into finding anomalous objects, let’s first look at what common objects look like for the RailSem19 Dataset. For the rail-track class, this corresponds to paired tracks going straight or steering slightly to the side.

In contrast, as we explore anomalous rail track objects, we quickly uncover an interesting rare scenario — single rail tracks or tracks captured from an unusual perspective. This leads us to a new area to explore further.

Identifying anomalous objects
By further inspecting anomalous rail objects, we can group them into two categories: data quality and obstructed object anomalies.
Data quality anomalies, grouping objects flagged as anomalous due to a low annotation quality, such as
- partial annotations, that provide insufficient coverage and representation of the intended objects, such as partial-line annotations or annotation gaps at road intersections.
- misclassified objects, such as rail lines annotated as rail-track.
- wrong annotations, such as single pixel masks that can unintentionally appear in the dataset due to unresolved annotation artefacts, incorrect preprocessing or data augmentations.
Systematically checking for data quality anomalies and curation can significantly improve the dataset quality and prevent biases and poor model performance. Frequent issues detected in this category can be a sign to improve your labelling standards.

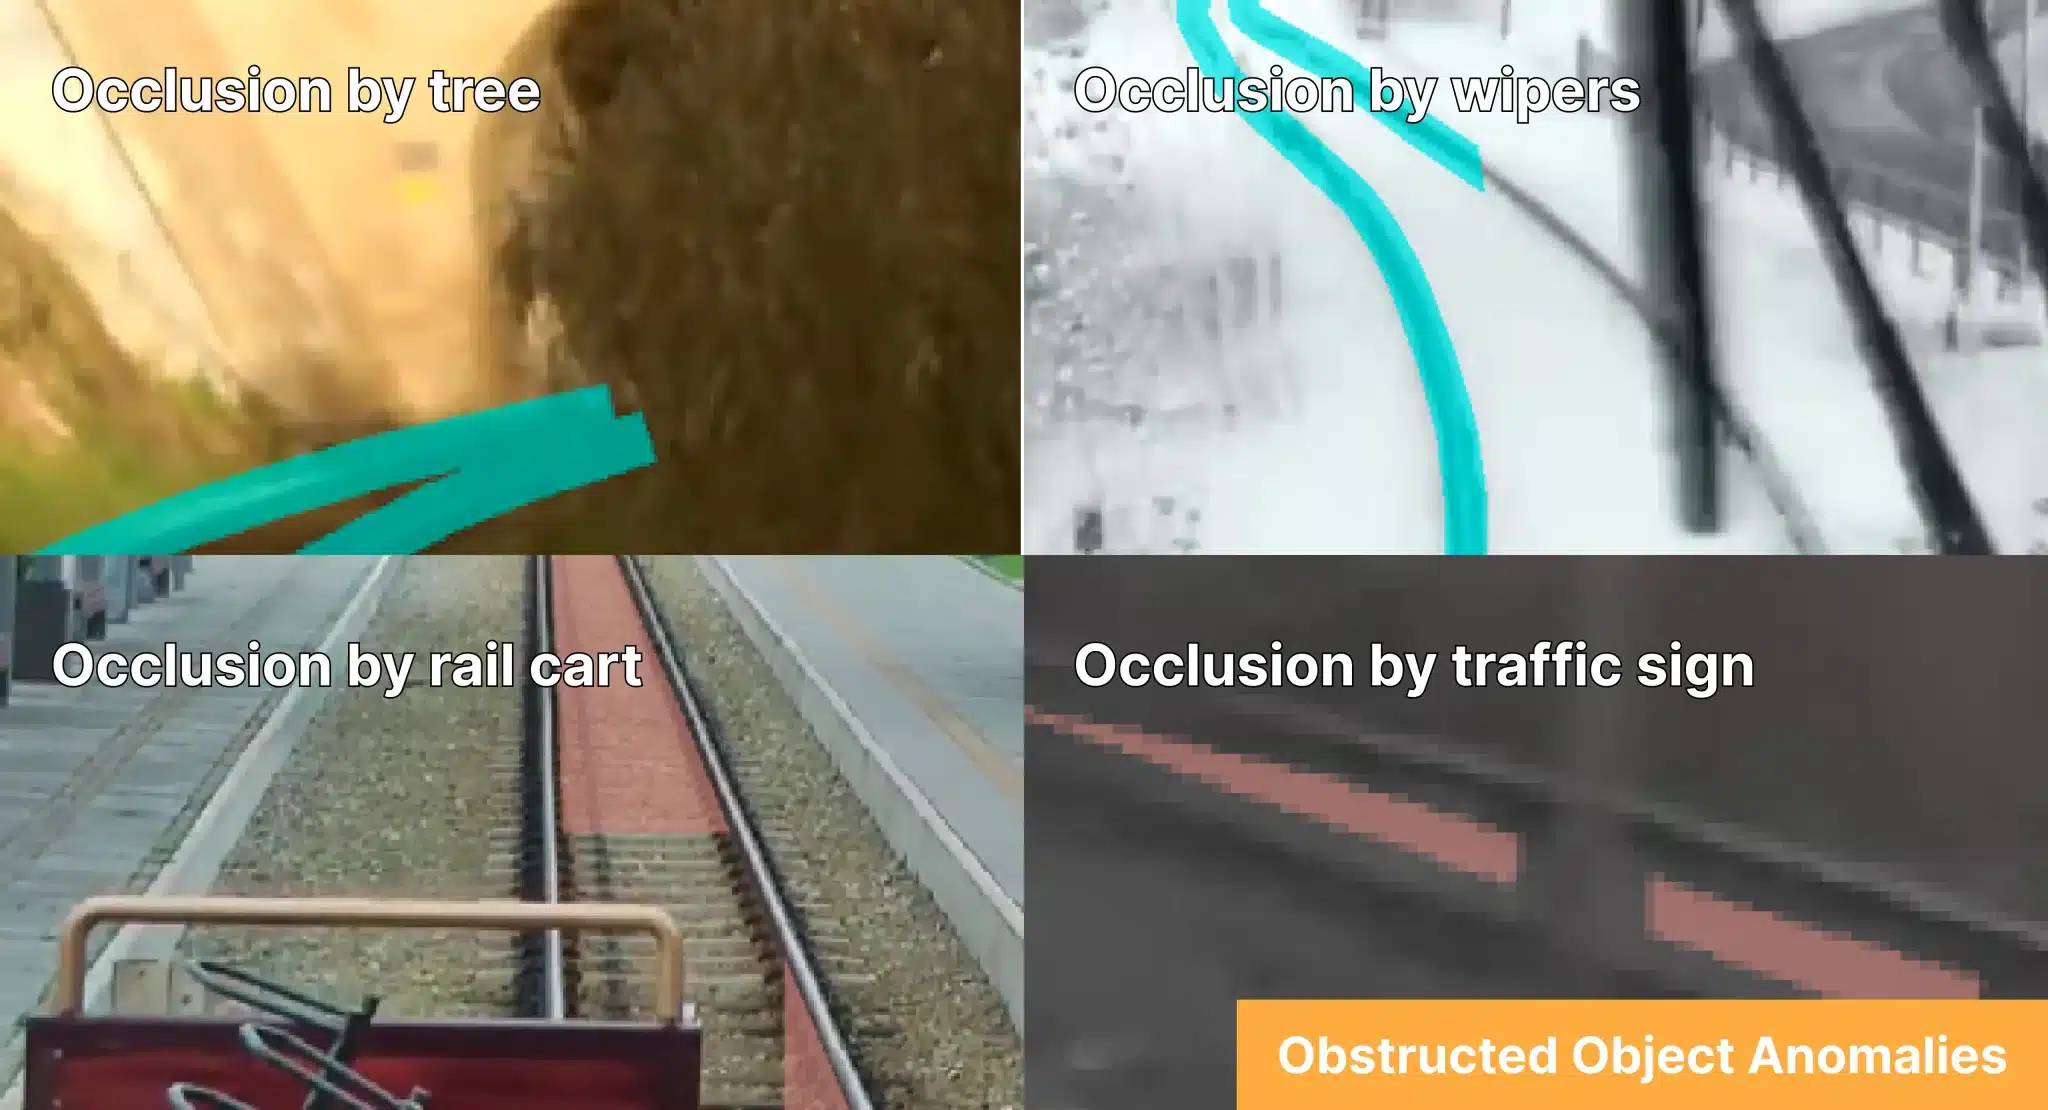
Obstructed object anomalies group objects that are obstructed or partially obscured by external factors, making it challenging for the model to make accurate predictions. In contrast to data quality anomalies, these do not directly correlate with the dataset’s annotation standards but are a result of the nature and unpredictability of real-world data. Examples of such anomalies in the RailSem19 dataset are occlusions of the objects of interest (e.g. rail-lines, rail-tracks) by surrounding objects such as trees, traffic signs, active wipers, or rail carts. These anomalies can be collected into a subset and used to continuously verify model robustness and accuracy in these rare scenarios.
Curation of anomalies at scale
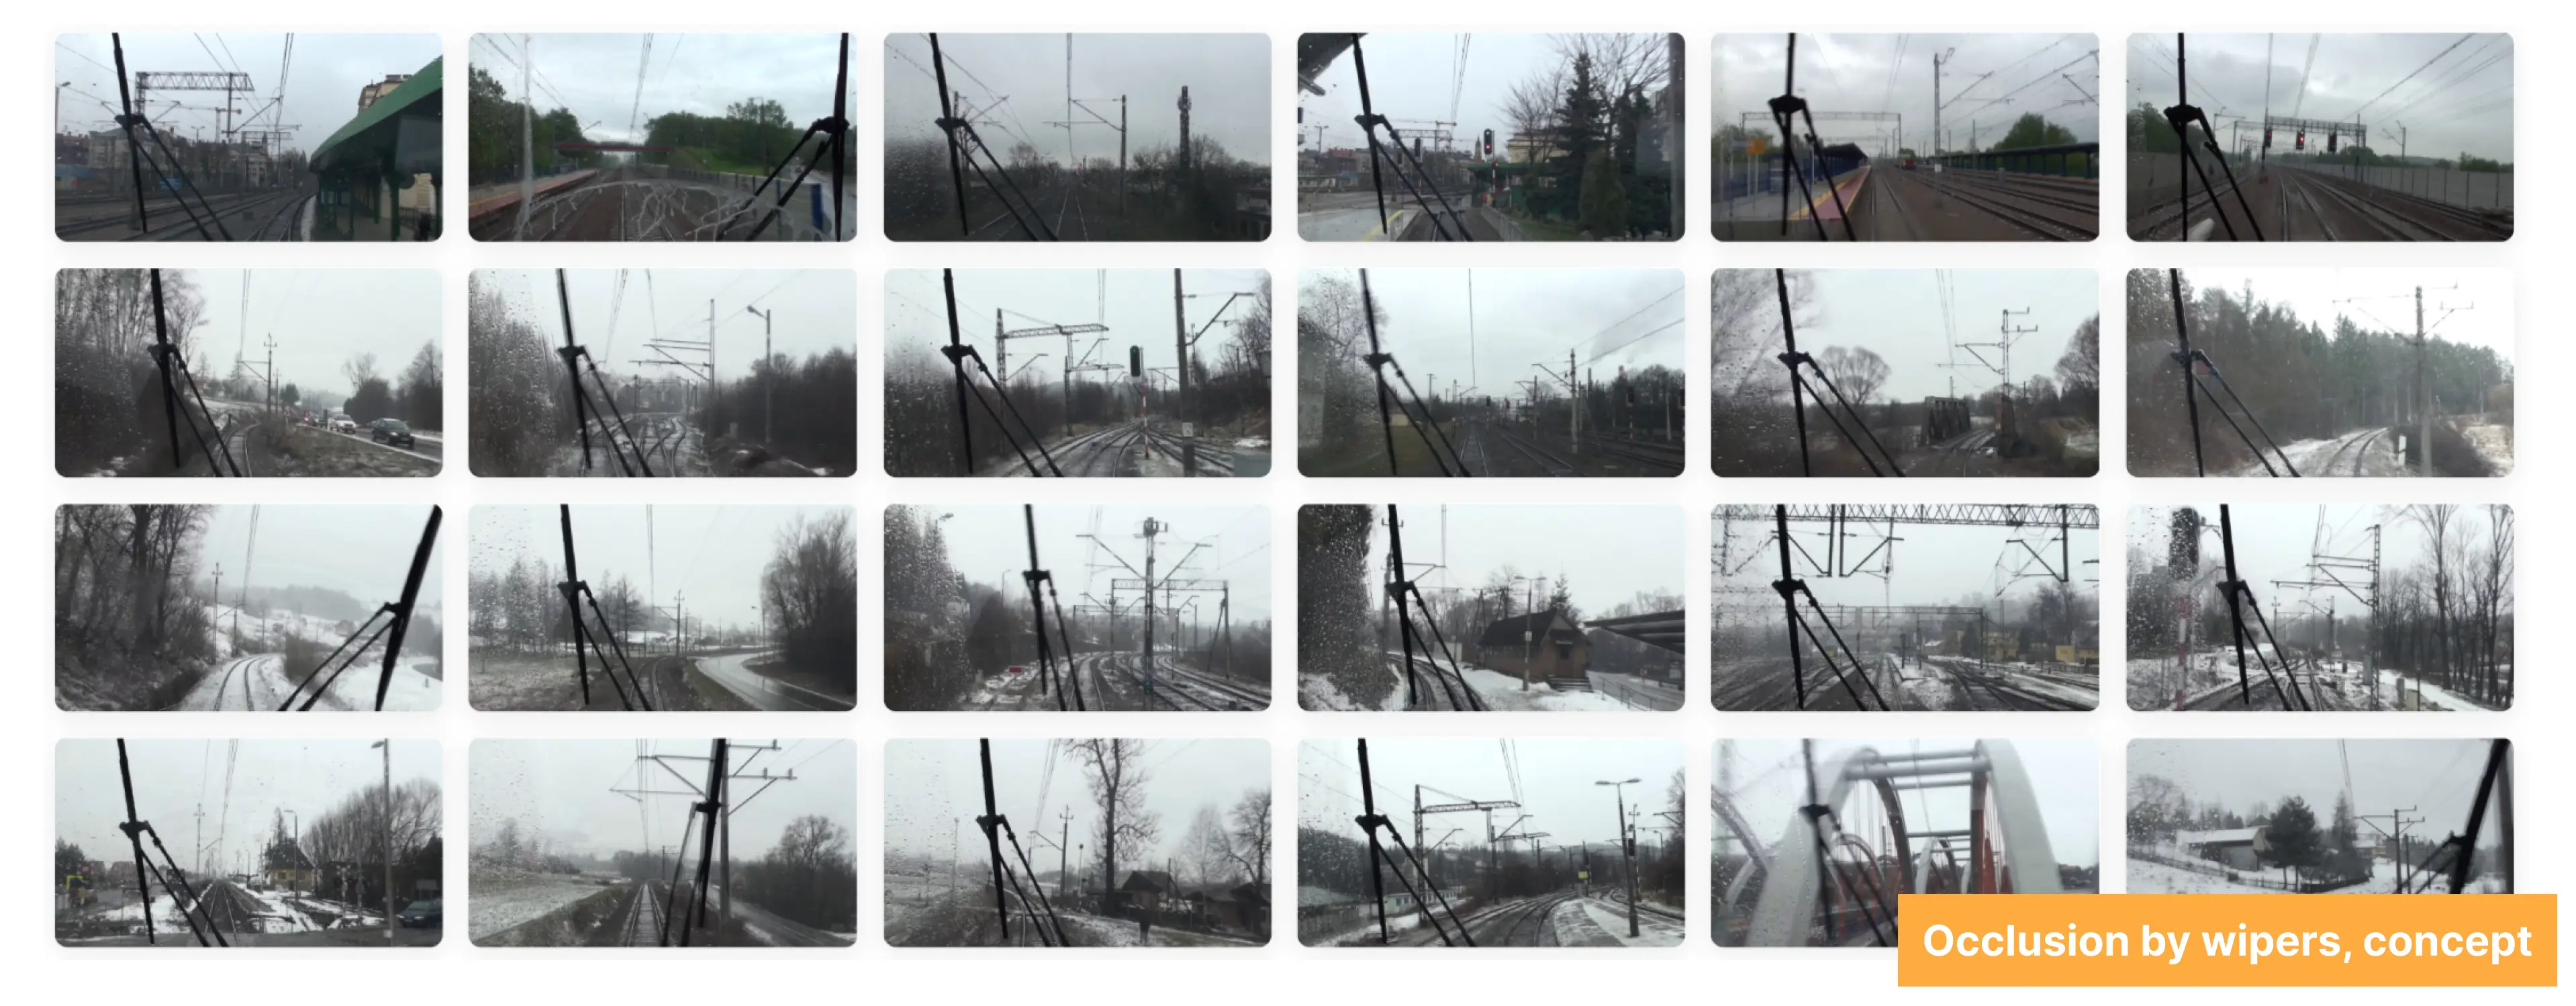
Identifying individual data anomalies is important, but when it comes to taking actions, we typically need to group them based on their root cause or environmental condition. This is exactly what we did above, except we did it manually, one sample at a time. To do this at scale, we need to find a way to automate this process. As a concrete example, let’s try to generalise the scenario with occlusion by wipers, with the goal of finding all such occluded samples in the whole dataset.
One way to approach this is using Embeddings — a powerful visualisation technique that extracts a high-dimensional representation of each sample (e.g., using foundational or task-specific models) and then uses dimensionality reduction methods to project it into 2-D space. Similar samples are then grouped in this space, often revealing useful data subsets. Unfortunately, the use of embeddings doesn’t work for this task due to its inherent limitations — it transforms the high-dimensional space into a 2-D representation in an unsupervised way without any knowledge of the scenario we would like to curate. Furthermore, anomalies are rare by definition therefore, their distinct patterns may not be preserved when projected from high-dimensional space. The poor embedding representation is visualised below, highlighting samples with wiper occlusions. As we can see, while some samples are somewhat close together, the data points generally do not cluster effectively. Unfortunately, the hope that an unsupervised clustering algorithm will provide a nice cluster of occluded wipers does not work in practice. This makes it very hard, or even impossible, to identify such scenarios using embeddings.

Similarity search is an alternative approach to retrieve similar images in a dataset, given a query consisting of one or more samples. In our case, we can use some anomalous samples as a query to retrieve all with wiper occlusions. Unfortunately, because the implementation of similarity search is based on the embeddings and their similarity (i.e., cosine distance), this approach shares similar limitations and will not work well either.
Concepts are a new approach to automatically learn user-defined attributes based on a user query. From the user perspective, the query can be the same as the one used for similarity search, but rather than simply using vector similarity in an unsupervised embedding space, concepts learn their own feature representation conditioned on the query. The key properties of this representation are that it is sparse to ensure generalisation and that the query samples are close together. We can see the corresponding concept for our occluded wipers example below.
Having collected all the samples, we can now choose the appropriate action. While removing anomalies classified as noise is an intuitive action to take, the appropriate action for other scenarios depends on the use case. As a rule of thumb, scenario-based model monitoring is the first step towards staying informed and keeping track of hidden model degradations across versions. The other actions include targeted data collection, data augmentation, synthetic data generation, checking for model blind spots, checking for spurious correlations, as well as checking for generalisation issues.
How to find data anomalies in the first place?
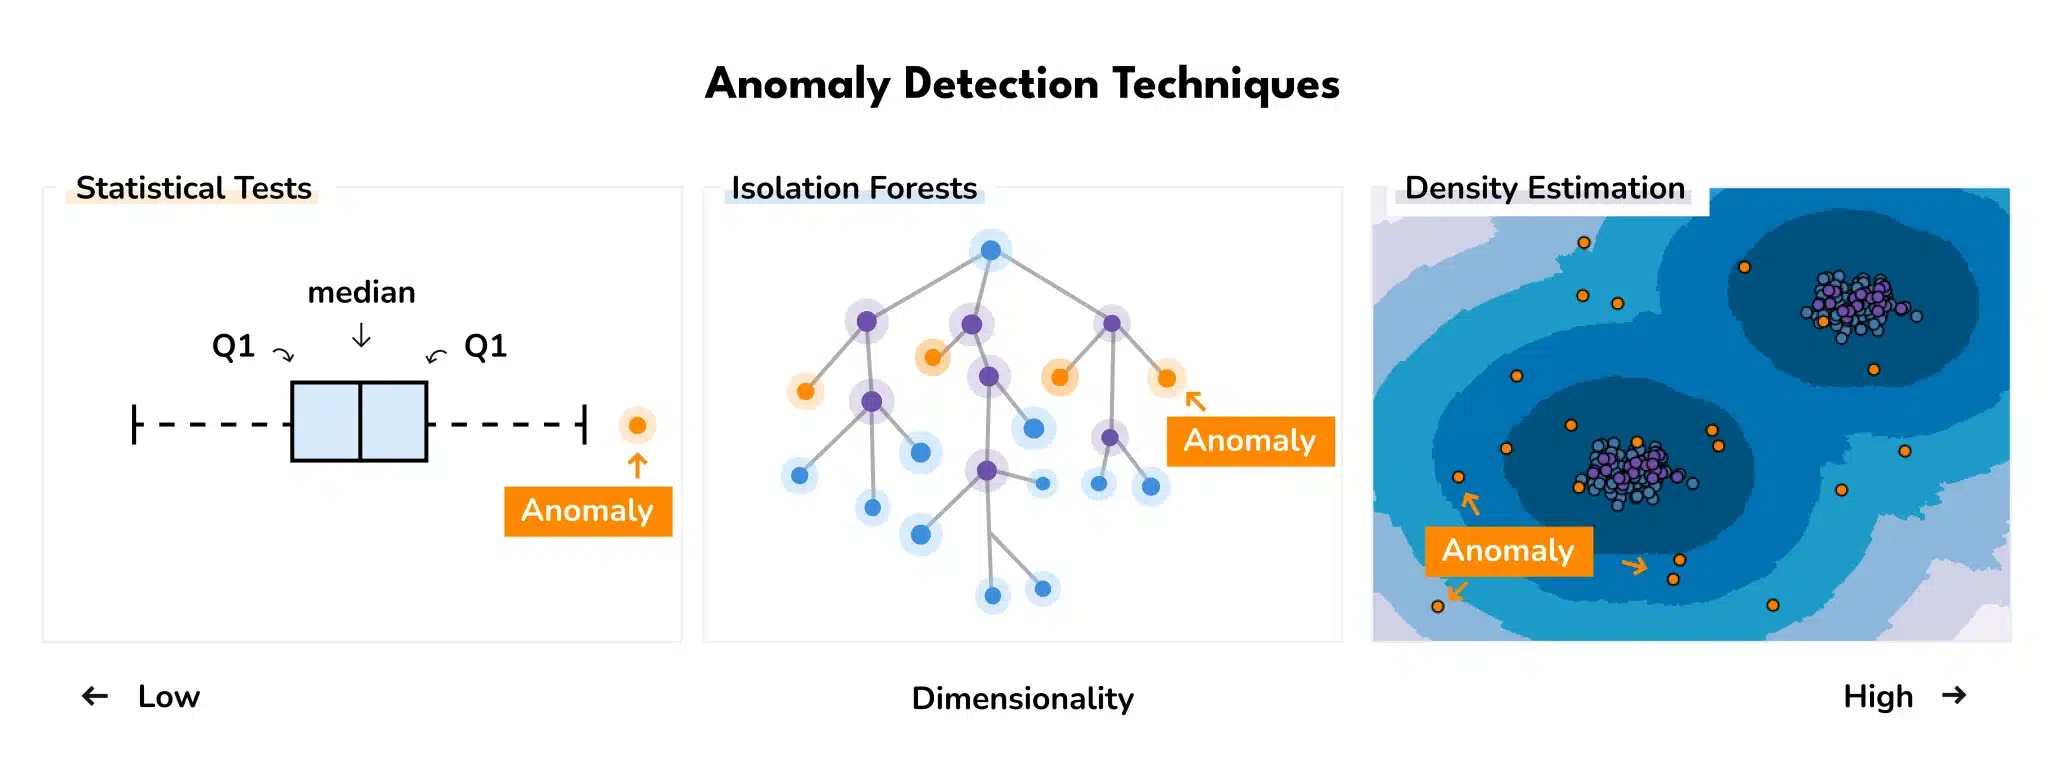
One way to find anomalies is by leveraging an unsupervised detection algorithm to compute anomaly scores, that is quantifying how much a sample deviates from the norm in the dataset.
Various research has been carried out to provide guidelines for when to apply which algorithm, both from a theoretical [3] point of view and by benchmarks on real data. Emmott et al. (2015) find isolation forest to perform the best overall but suggest using ABOG (Angle-Based anomaly detection) or LOF (Local anomaly Factor) in cases when multiple clusters are present in the data. It is important to note that supporting analysis at different levels of granularity is crucial, allowing us to explore conceptually different results.
Conclusion
Anomaly detection is one of the diverse challenges of deploying machine learning models in production [4]. Therefore, systematic anomaly detection should be part of the development pipeline of AI applications to help refine the reliability of the data and ensure the robustness of the deployed AI models.
Public datasets are not immune to anomalies, and overlooking them can lead to misintended AI model behaviour. During the exploration of the RailSem19 dataset, we identified several types of anomalous groups on the image level (i.e. environmental anomalies, rail-specific anomalies) and object level (i.e. data quality anomalies, obstructed object anomalies).
Stay tuned as we explore the next frontier of anomaly detection and its impact on model performance.
References:
- [1] Sean Harris, Cruise’s Continuous Learning Machine Predicts the Unpredictable on San Francisco Roads
- [2] K. Malik, H. Sadawarti, and K. G S. Comparative analysis of outlier detection techniques. International Journal of Computer Applications, 97(8):12–21, 2014.
- [3] A. F. Emmott, S. Das, T. Dietterich, A. Fern, and W.-K. Wong. Systematic construction of anomaly detection benchmarks from real data. In Proceedings of the ACM SIGKDD workshop on outlier detection and description, pages 16–21, 2013.
- [4] A. Paleyes, R-G. URMA, N. D. LAWRENCE: Challenges in Deploying Machine Learning: a Survey of case studies.


